Data Validation
This is the documentation for the validation functions.
Base Validation class
- class sam.validation.BaseValidator
Bases:
BaseEstimator,TransformerMixin,ABCAbstract base class for validators
Methods
fit(X[, y])fit method
fit_transform(X[, y])Fit to data, then transform it.
get_feature_names_out([input_features])Function for obtaining feature names. Generally used instead of the attribute, and more compatible with the sklearn API. Returns ------- list: list of feature names.
get_metadata_routing()Get metadata routing of this object.
get_params([deep])Get parameters for this estimator.
set_output(*[, transform])Set output container.
set_params(**params)Set the parameters of this estimator.
transform(X)transform method
validate(X)Validate the data.
- fit(X, y=None)
fit method
- get_feature_names_out(input_features=None) List[str]
Function for obtaining feature names. Generally used instead of the attribute, and more compatible with the sklearn API. Returns ——- list:
list of feature names
- transform(X: DataFrame) DataFrame
transform method
- abstractmethod validate(X: DataFrame) DataFrame
Validate the data.
This method should return a boolean array of the same shape as X, where True indicates a value that is invalid.
Detect Outside Range
- class sam.validation.OutsideRangeValidator(cols: list = None, min_value: float | dict | str = None, max_value: float | dict | str = None)
Bases:
BaseValidatorValidator class method that removes data that is outside the provided range
- Parameters:
- cols: list (optional)
Columns of input data to be checkout for being outside range. If None, all columns will be validated
- min_value: float, dict or “auto” (optional)
Minimum value to check against. If None, no minimum will be checked. If “auto”, the minimum value of the data will be used.
- max_value: float, dict or “auto” (optional)
Maximum value to check against. If None, no maximum will be checked. If “auto”, the maximum value of the data will be used.
Methods
fit(X[, y])Fit the transformer to the data.
fit_transform(X[, y])Fit to data, then transform it.
get_feature_names_out([input_features])Function for obtaining feature names. Generally used instead of the attribute, and more compatible with the sklearn API. Returns ------- list: list of feature names.
get_metadata_routing()Get metadata routing of this object.
get_params([deep])Get parameters for this estimator.
set_output(*[, transform])Set output container.
set_params(**params)Set the parameters of this estimator.
transform(X)transform method
validate(X)Transform the data.
- fit(X, y=None)
Fit the transformer to the data.
- Parameters:
- X: pd.DataFrame
Dataframe containing the features to be checked.
- y: pd.Series or pd.DataFrame (optional)
Series or dataframe containing the target (ignored)
- validate(X)
Transform the data.
- Parameters:
- X: pd.DataFrame
Dataframe containing the features to be checked.
Detect Extreme Values
- class sam.validation.MADValidator(rollingwindow: int | str, cols: list = None, madthresh=15)
Bases:
BaseValidatorThis transformer finds extreme values and sets them to nan in a few steps:
Estimate upper and lower bounds from the data in the fit method by computing median deviation above and below a running median
Mark differences outside these bounds as nan in the transform method
This class can be passed to the plot function (see Extreme value removal plot) to create a visualization of the removal procedure. It is advisory to take a look at this diagnostic plot to see if your rollingwindow parameter is sufficiently large to capture slow variations, without removing local peaks that might be ‘outliers’.
In addition, the default madthresh of 15 is relatively conservative. Less strict thresholds can be tried.
Note that you only pass cols that are suited for extreme value detection. For instance, a pump can sometimes be out of operation and so be set to 0. This signal is therefore not suited for extreme value detection.
Note that nans still have to be filled in with a later procedure.
Note that you should fit this method to the train set!
Parameters
- rollingwindow: int or string
if number, this amount of values will be used for the rolling window if string, should be in pandas timedelta format (‘1D’), and data should have a datetime index. A sensible value for this depends on your time resolution, but you could try values between 200-400.
- cols: list of strings (optional)
columns to detect extreme values for. If None, all columns will be used.
- madthresh: float
number of median absolute deviations to use as threshold.
Methods
fit(data)Estimate upper and lower bounds from the data by column by computing median deviation above and below a running median by column.
fit_transform(X[, y])Fit to data, then transform it.
get_feature_names_out([input_features])Function for obtaining feature names. Generally used instead of the attribute, and more compatible with the sklearn API. Returns ------- list: list of feature names.
get_metadata_routing()Get metadata routing of this object.
get_params([deep])Get parameters for this estimator.
set_fit_request(*[, data])Request metadata passed to the
fitmethod.set_output(*[, transform])Set output container.
set_params(**params)Set the parameters of this estimator.
transform(X)transform method
validate(X)Sets values that fall outside bounds set in the fit method to nan
Examples
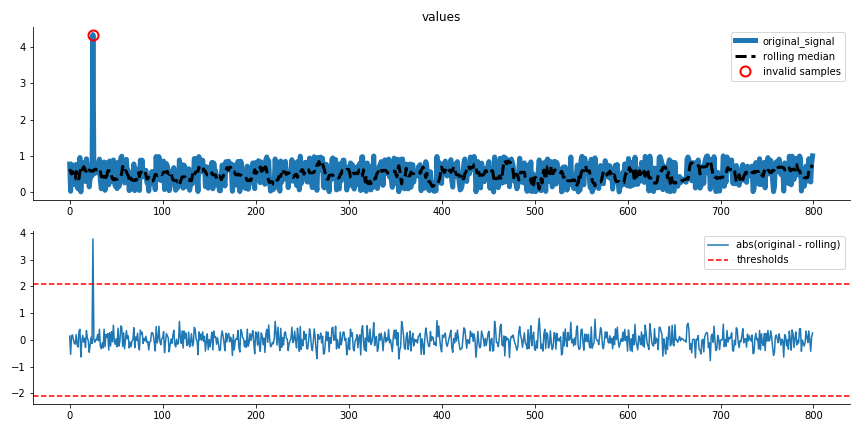
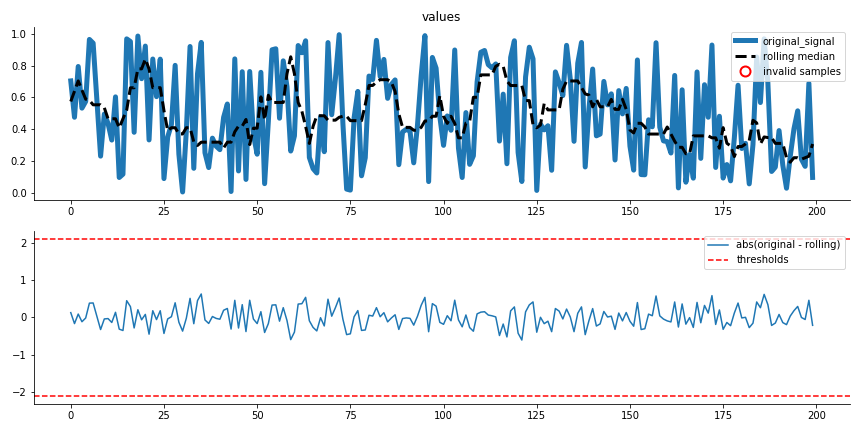
>>> from sam.validation import MADValidator
>>> from sam.visualization import diagnostic_extreme_removal
>>> import numpy as np
>>> import pandas as pd
>>>
>>> # create some random data
>>> np.random.seed(10)
>>> data = np.random.random(size=(1000))
>>>
>>> # split in train and test
>>> train_df = pd.DataFrame()
>>> train_df['values'] = data[:800]
>>> test_df = pd.DataFrame()
>>> test_df['values'] = data[800:]
>>>
>>> # with one clear outlier
>>> train_df.loc[25] *= 10
>>>
>>> # now detect extremes
>>> cols_to_check = ['values']
>>> REV = MADValidator(
...     rollingwindow=10,
...     cols=cols_to_check,
...     madthresh=10)
>>> train_corrected = REV.fit_transform(train_df)
>>> fig = diagnostic_extreme_removal(REV, train_df, 'values')
>>> test_corrected = REV.transform(test_df)
>>> fig = diagnostic_extreme_removal(REV, test_df, 'values')
- fit(data: DataFrame)
Estimate upper and lower bounds from the data by column by computing median deviation above and below a running median by column. This method creates the attiburte self.thresh_high and self.thresh_low that contain the respective bounds.
- Parameters:
- data: pd.DataFrame
with time indices and feature columns
- set_fit_request(*, data: bool | None | str = '$UNCHANGED$') MADValidator
Request metadata passed to the
fitmethod.Note that this method is only relevant if
enable_metadata_routing=True(seesklearn.set_config()). Please see User Guide on how the routing mechanism works.The options for each parameter are:
True: metadata is requested, and passed tofitif provided. The request is ignored if metadata is not provided.False: metadata is not requested and the meta-estimator will not pass it tofit.None: metadata is not requested, and the meta-estimator will raise an error if the user provides it.str: metadata should be passed to the meta-estimator with this given alias instead of the original name.
The default (
sklearn.utils.metadata_routing.UNCHANGED) retains the existing request. This allows you to change the request for some parameters and not others.Added in version 1.3.
Note
This method is only relevant if this estimator is used as a sub-estimator of a meta-estimator, e.g. used inside a
Pipeline. Otherwise it has no effect.- Parameters:
- datastr, True, False, or None, default=sklearn.utils.metadata_routing.UNCHANGED
Metadata routing for
dataparameter infit.
- Returns:
- selfobject
The updated object.
- validate(X: DataFrame)
Sets values that fall outside bounds set in the fit method to nan
- Parameters:
- data: pd.DataFrame
with time indices and feature columns
- Returns
- ——
- data_r: pd.DataFrame
input data with columns marked as nan
Trainset image:
Testset image:
Detect Flatlines
- class sam.validation.FlatlineValidator(cols: list = None, window: int | str = 1, pvalue: float = None, margin: float = 0, backfill: bool = True)
Bases:
BaseValidatorDetect flatlines and set to nan. Note that you have to check whether signals can contain natural flatliners (such as machines turned off), that might not need to be removed.
- Parameters:
- cols: list of strings (defaults to None)
columns to apply this method to. If None, will apply to every column.
- window: “auto” or int (default = 1)
number of previous equal values to consider current value a flatliner. so if set to 2, requires that 2 previous values are identical to current to set current value to nan. If set to “auto”, the threshold is derived in the
fitmethod. Based on a train set, the probability of difference being 0 is estimated. This probability can be used to estimate the number of consecutive flatline samples, before the likelihood is below thepvalueparameter The maximum acceptable flatline window is derived for each column separately, with the samepvalue- pvalue: float or None (default=None)
Threshold for likelihood of multiple consecutive flatline samples Only used if
window="auto"Small pvalues lead to a larger threshold, hence less flatlines will be removed- margin: int (default = 0)
Maximum absolute difference within window to consider them equal. Default is 0, which means that all samples within used window must be exactly equal to form a flatline.
- backfill: bool (default = True)
whether to label all within the window, even before the first detected data point. This is useful if you want to remove flatlines from the beginning of a signal. However, that is not always representative of for a real-time application, so one might want to set this to False.
Methods
fit(data)If window size is 'auto', derive thresholds for each column Threshold is based on the probability that a sensor value does not change.
fit_transform(X[, y])Fit to data, then transform it.
get_feature_names_out([input_features])Function for obtaining feature names. Generally used instead of the attribute, and more compatible with the sklearn API. Returns ------- list: list of feature names.
get_metadata_routing()Get metadata routing of this object.
get_params([deep])Get parameters for this estimator.
set_fit_request(*[, data])Request metadata passed to the
fitmethod.set_output(*[, transform])Set output container.
set_params(**params)Set the parameters of this estimator.
transform(X)transform method
validate(X)Validates the dataframe against the fitted dataframe.
Examples
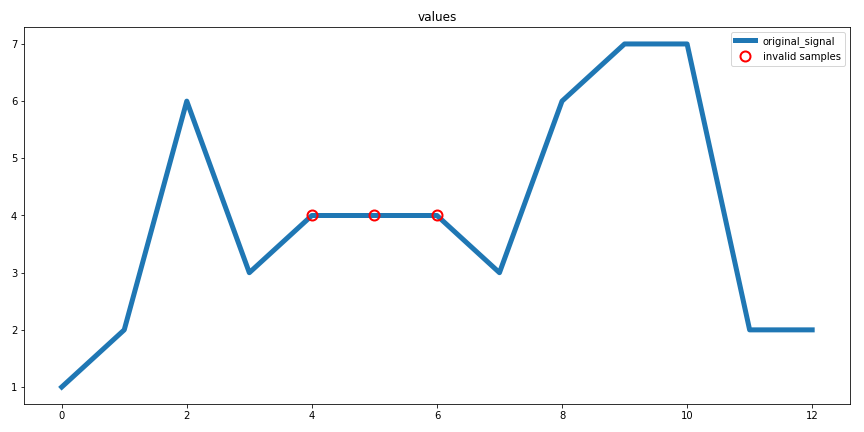
>>> import pandas as pd
>>> from sam.validation import FlatlineValidator
>>> # create some data
>>> data = [1, 2, 6, 3, 4, 4, 4, 3, 6, 7, 7, 2, 2]
>>> # with one clear outlier
>>> test_df = pd.DataFrame()
>>> test_df['values'] = data
>>> # now detect flatlines
>>> cols_to_check = ['values']
>>> RF = FlatlineValidator(
...     cols=cols_to_check,
...     window=3)
>>> data_corrected = RF.fit_transform(test_df)
- fit(data: DataFrame)
If window size is ‘auto’, derive thresholds for each column Threshold is based on the probability that a sensor value does not change. The likelihood of a flatliner of m time steps, is this probability to the power m. A threshold such that flatliners with a likelihood below the pvalue are removed.
- Parameters:
- data: pd.DataFrame
The dataframe to apply the method to
- set_fit_request(*, data: bool | None | str = '$UNCHANGED$') FlatlineValidator
Request metadata passed to the
fitmethod.Note that this method is only relevant if
enable_metadata_routing=True(seesklearn.set_config()). Please see User Guide on how the routing mechanism works.The options for each parameter are:
True: metadata is requested, and passed tofitif provided. The request is ignored if metadata is not provided.False: metadata is not requested and the meta-estimator will not pass it tofit.None: metadata is not requested, and the meta-estimator will raise an error if the user provides it.str: metadata should be passed to the meta-estimator with this given alias instead of the original name.
The default (
sklearn.utils.metadata_routing.UNCHANGED) retains the existing request. This allows you to change the request for some parameters and not others.Added in version 1.3.
Note
This method is only relevant if this estimator is used as a sub-estimator of a meta-estimator, e.g. used inside a
Pipeline. Otherwise it has no effect.- Parameters:
- datastr, True, False, or None, default=sklearn.utils.metadata_routing.UNCHANGED
Metadata routing for
dataparameter infit.
- Returns:
- selfobject
The updated object.
- validate(X: DataFrame) DataFrame
Validates the dataframe against the fitted dataframe. Returns a boolean dataframe where True indicates an invalid value.
- Parameters:
- X: pd.DataFrame
Input dataframe to validate
Trainset image:
Create validation Pipeline
- sam.validation.create_validation_pipe(cols: list, rollingwindow: int | str, remove_extreme_values: bool = True, remove_flatlines: bool = True, impute_values: bool = True, madthresh: int = 15, flatwindow: int = 2, max_iter: int = 10, n_nearest_features: int = 10, impute_method: str = 'iterative')
Sets up a pipeline to do data validation. Can incorporate:
remove extreme values
remove flatlines
impute values
Parameters
- cols: list of strings
which columns in the dataframe to apply data validation to
- rollingwindow: int or str
parameter used in RemoveExtremeValues, see RemoveExtremeValues
- remove_extreme_values: bool (default=True)
if set to True, will find extreme values and set to nan
- remove_flatlines: bool (default=True)
if set to True, will find flatline signals
- impute_values: bool (default=True)
if set to True, will impute found nan signals
- madthresh: int (default=15)
parameter used in RemoveExtremeValues, see RemoveExtremeValues
- flatwindow: int (default=2)
parameter used in RemoveFlatlines, see RemoveFlatlines
- max_iter: int (default=10)
how many iterations to try for iterative_imputer see https://scikit-learn.org/stable/modules/generated/sklearn.impute.IterativeImputer.html
- n_nearest_features: int (default=10)
how many close features to use for iterative_imputer Example <https://scikit-learn.org/stable/modules/generated/ sklearn.impute.IterativeImputer.html>
- impute_method: string (default=’iterative’)
if set to ‘iterative’, will impute values using IterativeImputer. This is much slower, but also much more accurate. Can also be set to any of the SimpleImputer strategies: ‘mean’, ‘median’, ‘most_frequent’, ‘constant’
- Returns:
- pipe: sklearn.pipeline.Pipeline instance
The input data should be a wide-format dataframe, where rows are time and columns are features. The rows of the data should be linearly increasing in time, and can contain gaps in time. However, when a string is used to specify the rollingwindow parameter, the input data should have a datetime index.
Examples
>>> import numpy as np
>>> import pandas as pd
>>> from sam.validation import create_validation_pipe
>>> from sam.visualization import diagnostic_extreme_removal, diagnostic_flatline_removal
>>>
>>> # create some data
>>> np.random.seed(10)
>>> base = np.random.randn(100)
>>> X_train = pd.DataFrame(np.tile(base, (3, 3)).T, columns=['1', '2', '3'])
>>> X_test = pd.DataFrame(np.tile(base, (3, 1)).T, columns=['1', '2', '3'])
>>> y_test = pd.Series(base, name='target')
>>> y_train = pd.Series(np.tile(base, 3).T, name='target')
>>>
>>> # add outliers to y_test:
>>> y_test.iloc[[5, 10, 61]] *= 30
>>> # add flatlines to y_train and y_test:
>>> y_test.iloc[20:40] = 1
>>> y_train.iloc[20:50] = 1
>>>
>>> # setup pipeline
>>> pipe = create_validation_pipe(cols=list(X_train.columns) + ['target'], rollingwindow=5,
...                              impute_method='iterative')
>>>
>>> # put data together
>>> train_data = X_train.join(y_train)
>>> test_data = X_test.join(y_test)
>>>
>>> # now fit the pipeline on the train data and transform both train and test
>>> train_data = pd.DataFrame(pipe.fit_transform(train_data), columns=train_data.columns,
...                           index=train_data.index)
[IterativeImputer] ...
>>> test_data = pd.DataFrame(pipe.transform(test_data), columns=test_data.columns,
...                          index=test_data.index)
[IterativeImputer] ...
>>>
>>> # the fitted pipeline can now be passed to diagnostic plot functions:
>>> # create validation visualizations
>>> f_ext = diagnostic_extreme_removal(
...     pipe['extreme'], test_data, 'target')
>>> f_ext = diagnostic_flatline_removal(
...     pipe['flat'], test_data, 'target')